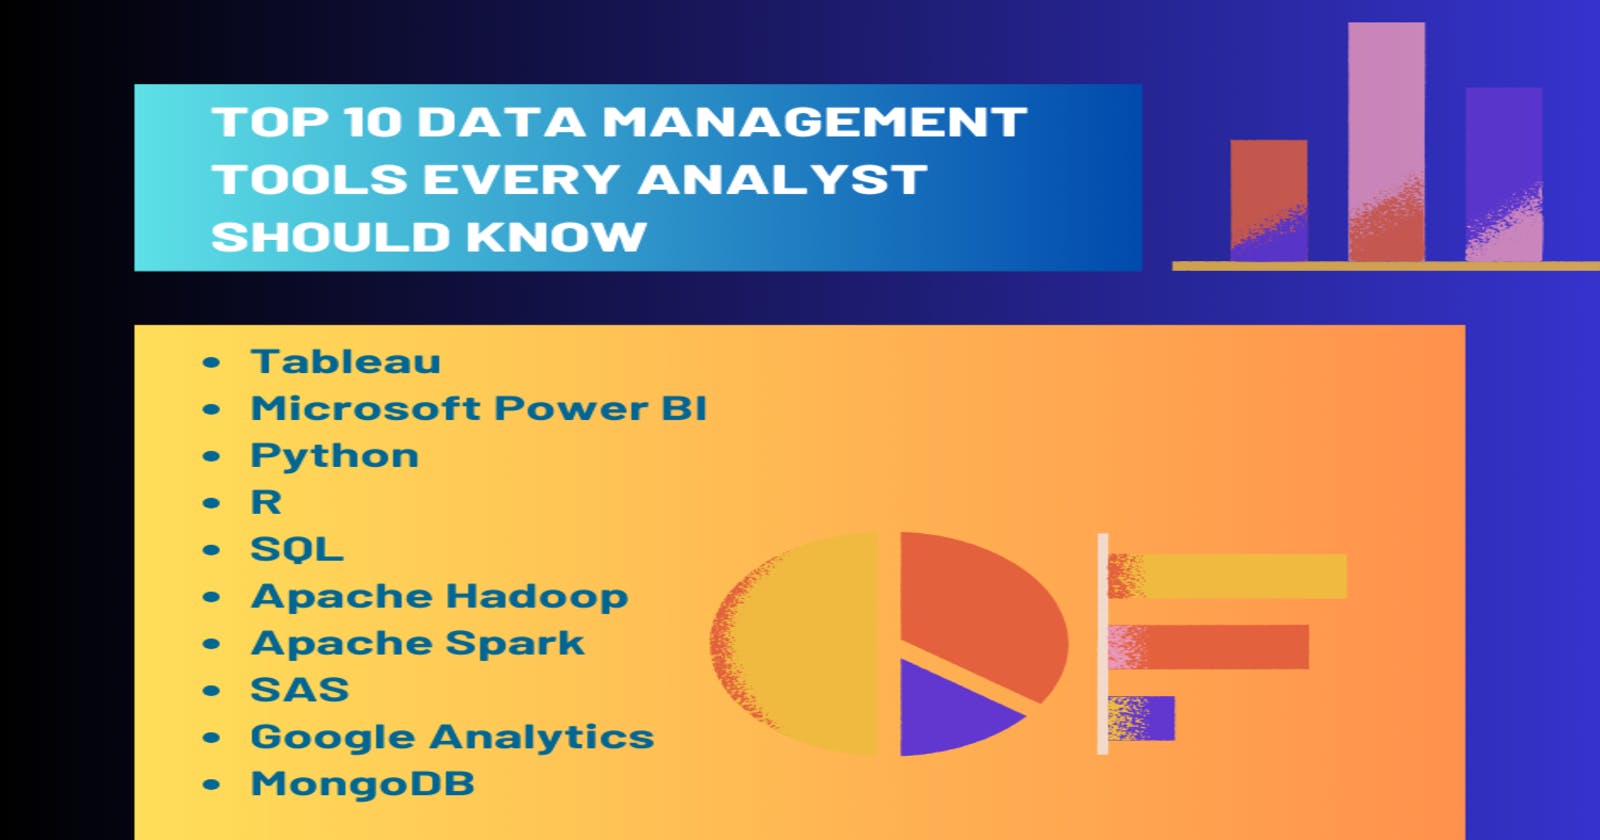
Data management tools are really important for people who analyze data. These tools help them do their job well. As businesses gather more and more data, it's super important to have good tools to handle it all. In this article, we'll talk about the top 10 data management tools that analysts should know about.
Why Data Management Tools are Important for Analysts
Good data management helps analysts find useful information and make good decisions. Without good tools, analysts might have a hard time going through all the data, which can make their work slower and less accurate. But with good tools, they can work better and find important insights faster.
What to Look for in Data Management Tools
When evaluating data management tools, analysts should consider several key factors to ensure they align with their specific needs and objectives. These criteria include:
Scalability: The tool should be capable of handling increasing volumes of data as the organization grows.
Integration capabilities: It should seamlessly integrate with existing systems and technologies to facilitate data flow across different platforms.
Security features: Robust security measures are essential to protect sensitive data from unauthorized access and breaches.
User-friendliness: Intuitive interfaces and ease of use are critical for maximizing user adoption and productivity.
Top 10 Data Management Tools
1. Tableau
Tableau is a powerful data visualization tool that allows analysts to create interactive and visually appealing dashboards. With its drag-and-drop interface, Tableau makes it easy to explore data and uncover insights. Analysts can create dynamic visualizations that help stakeholders understand complex trends and patterns at a glance.
2. Microsoft Power BI
Microsoft Power BI is another data visualization tool that is widely used in the industry. It integrates seamlessly with other Microsoft products, making it an excellent choice for organizations that rely on Microsoft ecosystem. Power BI offers a range of features, including interactive dashboards*, **reporting*, and *natural language querying**.
*
3. Python
Python has emerged as the preferred programming language for data analysis and machine learning*. Its extensive libraries, such as **Pandas and NumPy**, provide analysts with powerful tools for data manipulation and statistical analysis. Python's versatility and ease of use make it a valuable asset for any analyst.
*
4. R
R is another popular programming language used in statistical computing and graphics*. It offers a wide range of packages for **data visualization*, *modeling*, and *machine learning**. Analysts can leverage R's flexibility and extensibility to tackle complex data challenges effectively.
*
5. SQL
Structured Query Language (SQL) is a must-have skill for any analyst working with databases*. SQL allows analysts to query, manipulate, and analyze data stored in relational databases. Proficiency in SQL enables analysts to extract valuable insights from **large datasets** efficiently.*
6. Apache Hadoop
Apache Hadoop is an open-source framework for distributed storage and processing of big data*. It provides analysts with the ability to store and analyze large volumes of data across clusters of commodity hardware. Hadoop's scalability and fault tolerance make it an invaluable tool for big data analytics.
*
7. Apache Spark
Apache Spark is a fast and general-purpose cluster computing system that is well-suited for big data processing. It offers a range of libraries for data analysis*, **machine learning*, and *graph processing**. Spark's in-memory computing capabilities enable analysts to perform iterative and interactive data analysis tasks with ease.
*
8. SAS
SAS is a leading analytics and business intelligence software suite used by organizations worldwide. It offers a comprehensive set of tools for data management*, **advanced analytics*, and *predictive modeling**. Analysts can leverage SAS's advanced features to derive actionable insights from data.
*
9. Google Analytics
Google Analytics is a web analytics service that provides valuable insights into website traffic and user behavior. Analysts can use Google Analytics to track key metrics, such as page views*, **bounce rate*, and *conversion rates**. With its customizable reporting and real-time data capabilities, Google Analytics empowers analysts to optimize online performance effectively.
*
10. MongoDB
MongoDB is a NoSQL database that is well-suited for storing and managing unstructured data*. It offers flexible schema and scalability, making it ideal for handling large volumes of diverse data types. Analysts can use MongoDB to build high-performance applications that require fast and agile data access.
*
Comparison of the Top Tools
After exploring each of the top 10 data management tools individually, it's crucial to compare their features, strengths, and weaknesses. This comparative analysis will help analysts make informed decisions based on their specific requirements and preferences.
Tips for Maximizing the Effectiveness of Data Management Tools
To maximize the effectiveness of data management tools, analysts should:
Stay updated with the latest features and functionalities through regular training and professional development.
Collaborate closely with IT teams to address technical challenges and optimize performance.
Continuously monitor and fine-tune data management processes to ensure optimal efficiency and accuracy.
Conclusion
Data management tools are indispensable for analysts seeking to unlock the full potential of their data. With the right tools, they can work better and make smarter decisions.
